Essential tips for high-latitude cruising
Each month, on our social media, we focus on a given cruising destination. This month we’re heading out to the end of the world 👇
Pictured is Ventisquero Guilcher, one of the many glaciers descending from fractal-shaped Cordillera Darwin. This mountainous peninsula forms the westernmost part of Tierra del Fuego. It juts out 100 miles westward from the rest of the celebrated Patagonian island (the 29th largest in the world and largest in South America).
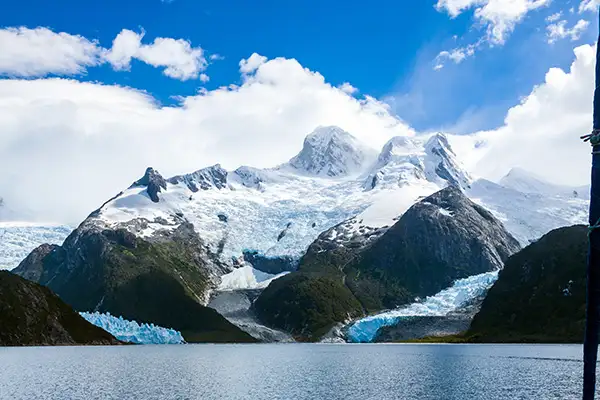
🏔️ Rising more than 2’000 meters above the surrounding seawater inlets, it makes for one of the most scenic cruising grounds on the planet. Branching in from Canal Beagle at its south or Canal Magdalena at its north are dozens of fjords, at least 10 of those featuring tidewater glaciers at their head. A spectacular sight! 🤩
This glacier is one of the most accessible. But despite being just 60 miles west of Ushuaia 🇦🇷, it is still quite an adventure to get there, though. For starters, one first needs to sail the 50-mile roundtrip to Puerto Williams 🇨🇱 to check in to Chile. But most of all, sailing in these cold and remote waters is particularly demanding.
👉 Let’s use this opportunity to share a few tips to make it all possible. Be sure to follow us so you don’t miss them.
Your custom light icebreaker
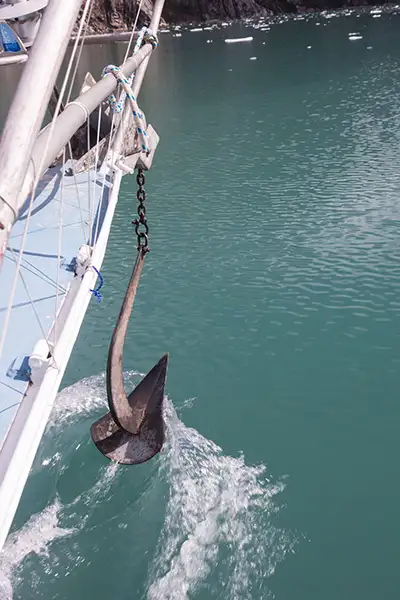
What’s going on? Why have this anchor surfing ahead of the boat? ⚓️
Here’s a first tip we found useful when visiting glacial inlets. When there are a few bergy bits here and there, it can be useful to dangle the anchor so that it just skims the water. It then acts as a light icebreaker, pushing small bergs aside so they don’t hit the bow.
🧊 Of course, larger growlers should still be avoided. And this only works as long as the density of the ice does not increase. But this technique will allow you to maintain a nice pace while motoring in sparsely iced waters (as can be seen in the background).
It can be quite a tangle!
In high latitudes, anchoring is often supplemented by shore lines. It’s commonplace to drop the hook in 15 meters of water, without room to fully swing around. In fact you even want to be tucked in close to the trees so the gusts can’t hit the hull.
This calls for some serious tying ashore. One, two, and even up to four lines can be tied to sturdy trees, an anchor ashore, or to rock formations (in which case chafe is best avoided by wrapping a few meters of chain around the rock, and then tying the mooring line to the chain loop).
Lines should be at least 60 meters long. 100 meters is better. Which means there could be 400 meters of line happily looping and twisting on deck. You get the point: if you haven’t organized something, it will all end up as a giant knot.
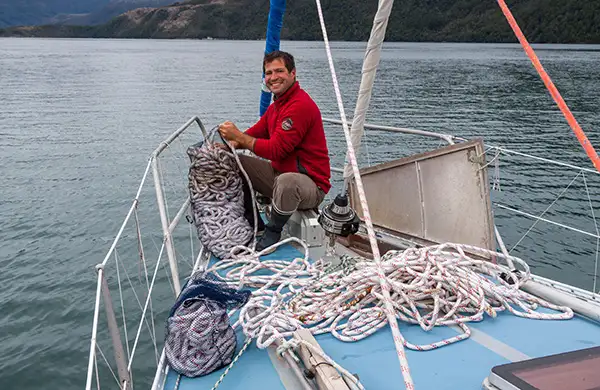
If you’re lucky enough to have reels of flatline installed, maneuvers will be easy. Otherwise, it’s easy to simply put together some mesh bags which will keep the lines nice and tidy. You’ll be ready to feed them out without hiccup when needed. It does require more time to store them back in, though.
One last point about the material: in most cases, it’s best to opt for floating polypropylene lines. This makes it possible to tow a line ashore under oars without it sinking under its own weight. On the other hand, if you plan to moor in places where ice floes can make it into the anchorage, classical sinking lines are best. Otherwise they will trap the floating ice and snap under the pressure.
Forecast beware !
Having access to weather data is great. Knowing how to interpret it is better.
We’re still cruising Patagonia. It looks like a great day for sailing into Canal Wide (red dot, middle right). Only 18 knots are forecast, and even less further north.
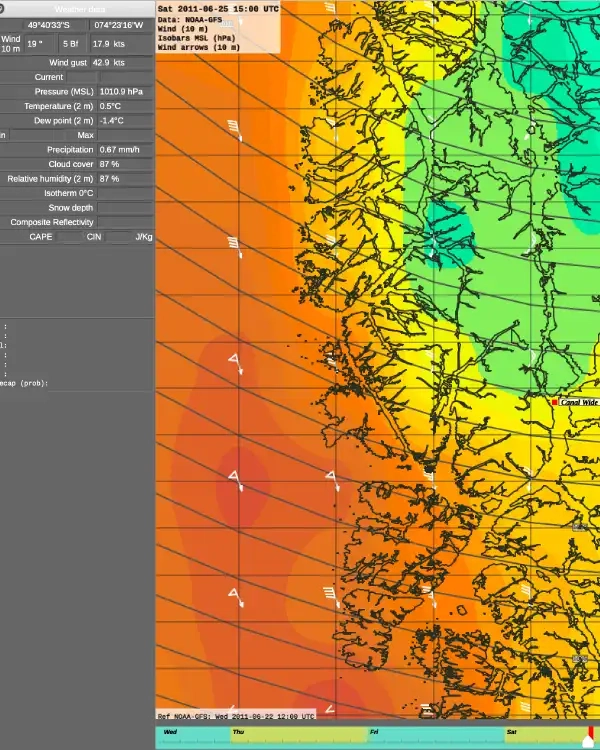
It’s important to remember, though: the driver behind wind is atmospheric pressure. And clearly, nothing here shows the gradient is any different inside the Chilean channels as opposed to outside in the Pacific Ocean. The spacing between isobars is pretty much the same. And the triangular barb shows 50 knots are forecast just outside the archipelago…
Another hint that might help us spot this? Look at the gusts forecast: 43 knots. That’s a lot, given an average speed of 18 knots. Much more than normally. The thing is: the model calculates an average wind speed not only over time, but also over a large area, much of which is mountainous land, which will be protected from the wind.
In short, on the water, it wouldn’t be surprising to face 45 to 50-knot winds. And probably more in places where the terrain can funnel the flow. A far cry from the 4 Beaufort an unsuspecting yachtie could expect.
It doesn’t just come from above
When cruising the high latitudes, the cold mainly creeps in from below 🥶
At the head of glacial inlets, we recorded water temperature as low as 2.8°C (37°F) 🌡️ Combined with very damp air, this can quickly make life aboard miserable. Unless you have a way to keep the boat warm and dry. Of course, some people manage without. But being fully equipped will make your experience much more enjoyable.
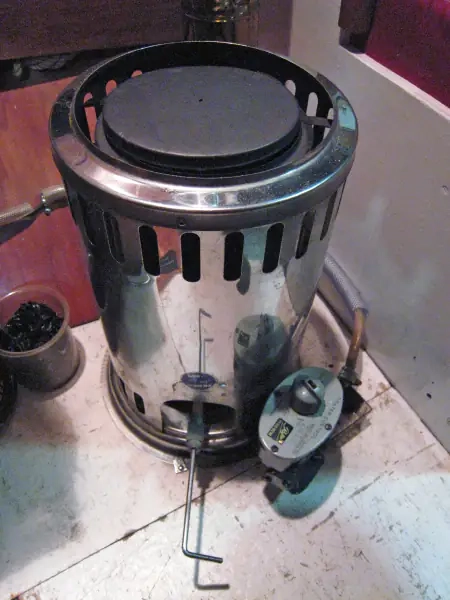
♨️ Heaters mostly come in two flavors: forced-air and stoves. Although the former are very easy to use, those plying the Patagonian waters seem to prefer stoves for their simplicity and reliability.
It takes more work to manage the lighting, the diesel flow and the occasional backdraft in the flue. But we can say that nothing beats the warm, dry feeling of a stove in the saloon while a gale lashes the deck with driving rain 🔥🌧️
E. del P.
What does that even mean? And what do I do with it? 🤔
If you’re venturing into the Chilean channels, that’s what you might be asking yourself, once you glance at the charts.
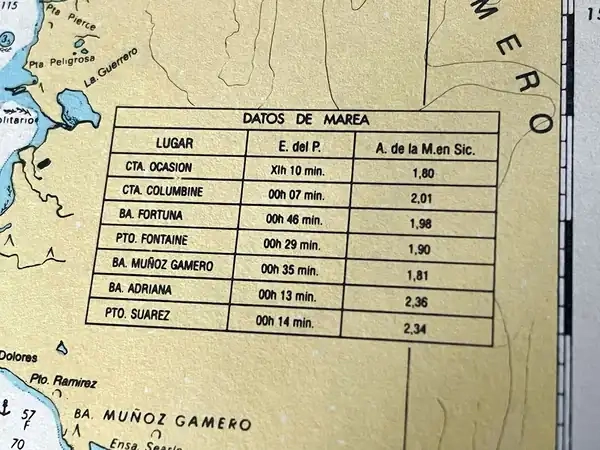
It’s got to do with the tides (marea), right?
The fact is: the Chilean hydrographic service can provide tide predictions only for a handful of points along its 4’300 km stretch of Pacific coastline. But the myriad islands and channels in its Patagonian region make for intricate and complexe tidal patterns.
So how can you get the proper predictions for whatever area you’re located in?
That’s where you need to revert to the good old way of doing it, before there were any tide tables. The last column seems pretty straightforward. It provides a tidal range (in meters). In fact, A. de la M. en Sic. stands for Amplitud de la marea en sizigia (= tidal range at spring tides). In this area, it’s about 2 meters. Good.
E. del P., on the other hand, remains far more cryptic. Yet, let’s think physics for a bit. Tides are a forced oscillation phenomenon, whereby the ocean reacts to a periodical stimulus, every 12 hours and 25 minutes or so. The ocean’s response takes place with a certain delay (the phase shift or lag). And that’s consistent with our second clue: the values are, indeed, given in hours and minutes! By the way, note that on the first line, eleven is given as roman numerals XI 😉
Now, how can we use this delay?
Well, the maximum tidal force is exerted when the moon is high in the sky 🌖 But determining that while winding the Chilean channels, where the nearest signal is hundreds of miles away, can be a daunting calculation. If an app, or your GPS(Global Positioning System) Satellite positioning system with worldwide coverage, enabling users to determine not only their latitude and longitude, but also their heading and speed. More, can give you moonrise and moonset times, though, you’re all set. These would correspond to minimum tidal force. Add the delay to either one and you’ll get the approximate time of low tide. High tides will be pretty much halfway in between.
🕥 And that’s how you can plan for tides in hundreds of caletas (coves) and straits, using information provided on each nautical chart! As always about equipment: carrying it is a good start, but knowing how to use it is even better.
Oh, and, by the way, E. del P. actually means Establecimiento del Puerto, i.e. Establishment of the port. Wikipedia provides this definition: “the technical expression for the time that elapses between the moon’s transit across the local meridian at new or full moon at a given place and the time of the next high water at that place.” Which is exactly what we’ve been calculating. Yay! 🙌
It goes on saying “Before the creation of modern tide tables, it was a quick way of predicting the time of local high water.” And indeed, this is the type of observation James Cook noted in his journals for every place he visited.